Forex Technical Analysis: Identifying and Using the Elliot Wave
The Elliot wave is a concept or principle that was named after the discoverer Ralph Nelson Elliot, in the 1930s. It defines the behavior of groups of people by showing that there are massive psychological swings in behavior of people from pessimism to optimism and back in any natural sequence. This creates specific graphical patterns which are therefore measurable.
In Forex this principle is used to measure the investors‘ psychology. When investors are optimistic they invest more, and take more risks. While during the pessimistic periods, they take lesser bids and lesser risks.
The Forex market is one of the best and most effective places where this principle is seen in full swing. The behavior of investors keeps swinging from positive to negative as the prices shift from favorable to non favorable. According to this principle, if one can identify the repeating patterns in prices, on can figure out his or her current position in the market, and predict the position in the near future as well.
Identifying the Elliot Waves
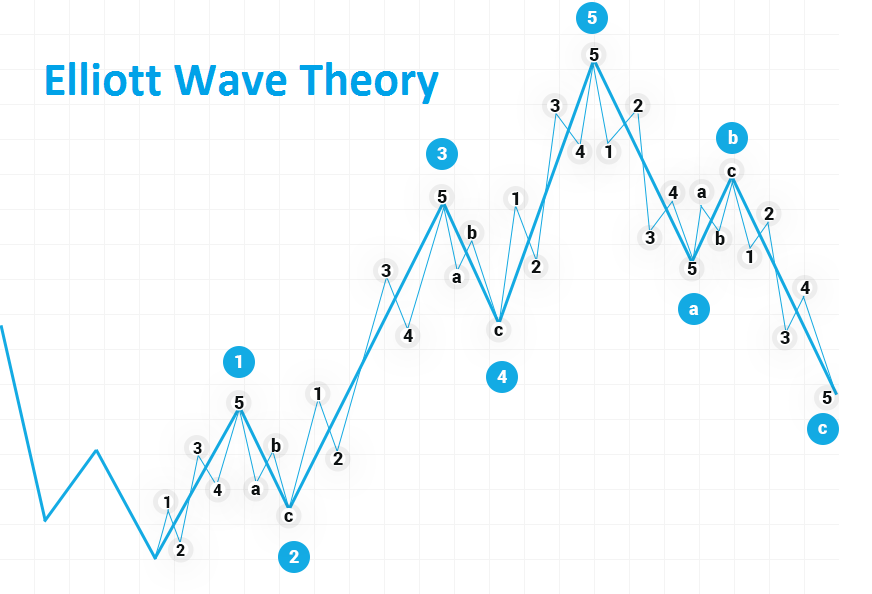
The Elliot is a technical tool, represented as a chart. The pessimism and optimism cycles in the market are seen as two types of waves in the graph, these are:
Impulse wave / Corrective wave
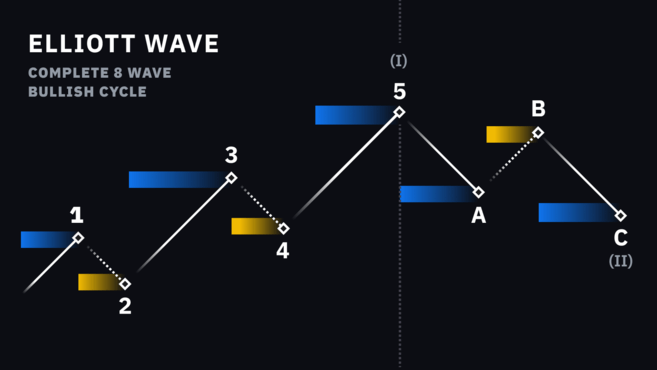
The impulse waves are further subdivided into 5 wave structures numbered 1 to 5. While the corrective waves are sub divided into 3 wave structures, labeled a – c. Both the impulse and corrective waves are interconnected and are easy to identify.
The graph above identifies the various impulse and corrective waves.
Using the Elliot Waves
Once the sets of five and three waves have been identified, they can be used to interpret the markets and predict where they are heading. However we must bear in mind that the Elliot waves are only a prediction and not a certainty. It is all about probability.
The outcomes of the Elliot waves can be used to interpret the exits and occasionally the entries. These waves can therefore be used as a road map. Traders who watch the pattern can see a consistency in its outcomes and then get a rough idea on what the market scenes are like and what course they are on.
The waves follow certain rules which keep the number of valid interpretations to a minimum count, also referred to as “alternate counts”. Analysts look out for those waves which satisfy the larger number of guidelines. The top alternate counts are considered the ones which satisfy the largest number of guidelines. Therefore the alternate counts are the ones which are an essential aspect of this principle.
The Fibonacci ratio is another key application of the Elliot waves. The use of the Fibonacci ratios is based on the principle behind the Elliot waves. The concept employed here is that the corrective waves retrace the previous impulse waves of the same magnitude in the Fibonacci ratio. The common wave relationships seen are 38%, 50% and 62%. The second waves in the Elliot charts will be of the same magnitude and will be closely related to the others in the Fibonacci proportions.
The combined use of the Elliot waves and the Fibonacci ratios is a strong tool which is also employed in establishing strategies and reducing risks. Therefore these waves are useful in interpreting the direction of the market, the current trends, expected rises in prices and the expected fall in rates.
However it must also be mentioned that learning and mastering the principles behind these waves is not as easy as it seems. It requires years of experience and a lot of hard work. This is only possible when one never gives up. The Forex markets are usually unpredictable and traders face a lot of losses. Most give up and leave the Forex trading career while only a few keep struggling.
