Forex Trading Basic Tools – Candlesticks Chart
Candlesticks are tools used for technical analysis of financial instruments such as securities, derivatives or currencies. A candlestick chart converts a continuous time series into a series of discrete technical symbols. The density of candlesticks in a candlestick chart depends on the period of analysis- for instance, when converting intraday data to candlestick charts, one can chose the interval period for each candlestick as one hour (or any other value). This would convert the continuous intraday line graph to a candlestick pattern with a candlestick for every hour.
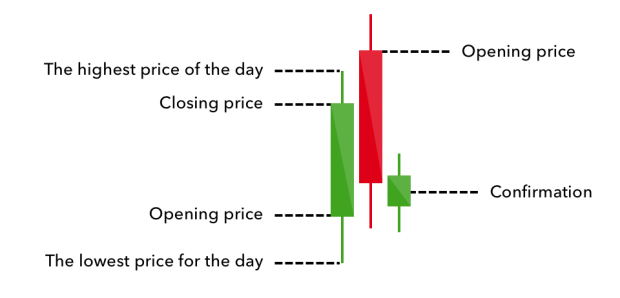
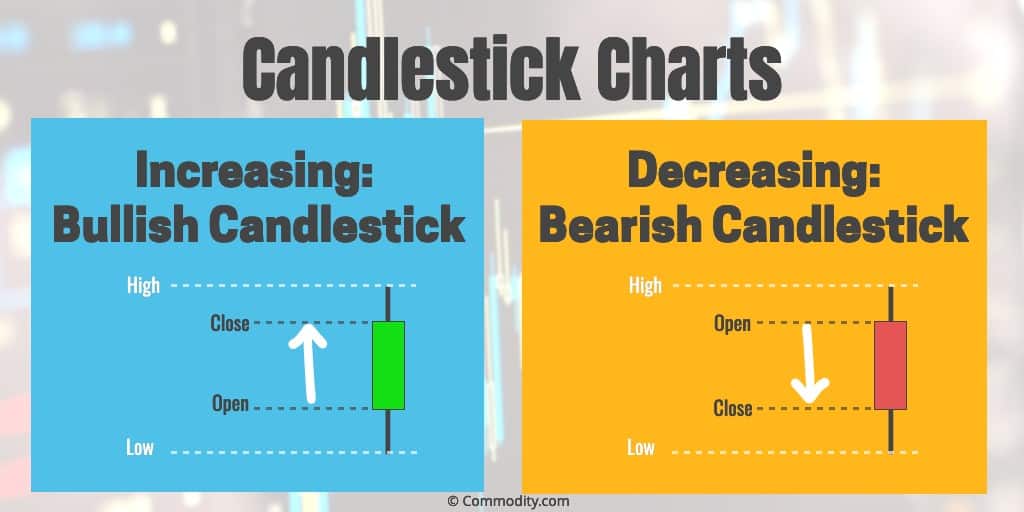
Each candlestick comprises four data points of the instrument for the period of analysis – the open, high, low and close values. The body of the candle is capped by the open and close prices. If the open is lower than the close the candle is usually indicated in white, green or occasionally blue. For a closing value below the opening value, the body is indicated in black or red. The other components of the candlestick are the upper and lower shadows (or wicks). The upper shadow is a line extended from the top of the candlestick body and extends up to the high price of the instrument. The lower shadow extends from the bottom of the body to the low value of the instrument for the period. Either of these components – the body or the wicks – may be absent in any candlestick when a few data points match. In the particular case of all points being identical, the candlestick does not exist at all.
A number of complex patterns and technical analysis techniques have been formulated on candlesticks. We emphasize on a few simple patterns for starters.
A white, green or blue candlestick is a bullish signal indicating uptrend. The more number of consecutive white candlesticks and the longer the bodies, the more bullish the signal. Similarly, a black or red candlestick (or a series of such candlesticks in progression) signify selling – a bearish signal indicating downtrend.
A long upper shadow with a length of at least equal to the body indicates a bearish signal. This signal is strengthened if the body is black. Similarly, a long lower shadow with length more than the body indicates an uptrend, reinforced by a white body.
A Doji is a pattern where the open and close coincide reducing the body size to zero. This is normally a neutral sign used in conjunction with other signals. A Doji pattern above a white candlestick is a possible reversal signal (bearish), strengthened by a subsequent black candlestick. This kind of a candlestick pattern is called a Doji Star. A bullish Doji Star is a Doji subsequent to a black candlestick and placed below it.
ion of the Doji Star where a Doji follows a long black body. The candlestick following the Doji is a white body where the upper limit of the white body is beyond half of the black body’s length. This indicates a reversal of a bearish trend. A Morning Star is the same as a Morning Doji Star except that the Doji in between the two candlesticks is replaced by a small body (open and close values are close together). This is also a bottom reversal signal. Reversing a Morning Doji Star or a Morning Star, we get Evening Doji Stars and Evening Stars which are considered top reversal signals.
A Harami is a combination of a large white body candlestick followed by small black body. The following black body needs to have the open and close limits of its body i.e. contained within the preceding white body’s limits. This is considered a bearish signal when preceded by a Bull Run. For a bullish Harami signal, a large black body is followed by a contained small white body with the same conditions as a bearish Harami.
A Hammer is a small bodied candlestick (black or white) with a very small or non-existent upper shadow and a long lower shadow indicative of an uptrend. An Inverted Hammer is a bottom reversal signal with a small body and long upper shadow.
Exhibit D: Other candlestick patterns (Spinning Tops, Hammer, Inverted Hammer, Harami)
Another key technical candlestick pattern is a Spinning Top, which is neutral in nature and typically used with other technical signals. This pattern consists of a single candlestick with a small body and tiny shadows.