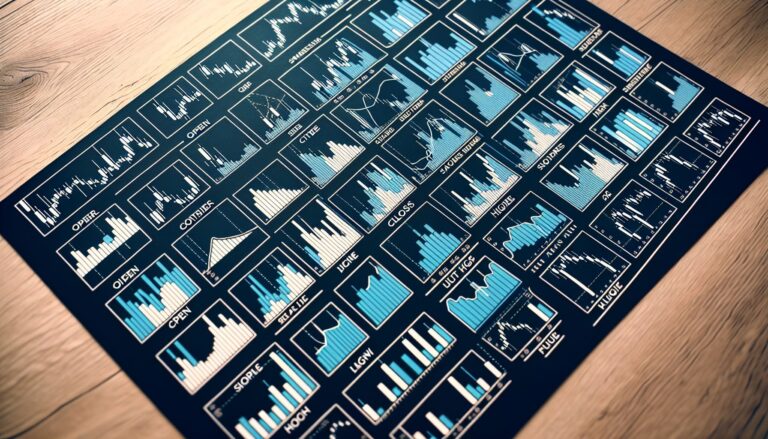
Candlestick Patterns in Day Trading: A Comprehensive Guide for Active Traders
The allure of day trading lies in its potential for fast profits. Many of us have heard stories of day traders making thousands in a matter of hours from minor stock price fluctuations. However, the truth is, profitable day trading requires not only keen instincts and a stomach for risk but also a solid understanding of technical analysis tools, one of the most crucial among them being candlestick patterns.
Candlestick patterns have long been part of the toolkit of seasoned traders across the globe. Originating in Japan over 300 years ago, these charting methods have stood the test of time, proving their effectiveness in predicting future market movements. This blog post delves deep into understanding these vital trading indicators and their role in day trading.
Understanding Candlestick Patterns
Candlestick patterns are graphical representations of price movements in a specified period. Each “candlestick” consists of a body, which shows the opening and closing price, and wicks (or shadows) that display the high and the low price of that period.
Importantly, the color of the candlestick body reveals whether prices increased (usually green or white) or decreased (typically red or black) during that period. These simple visuals provide a wealth of information about the market’s emotional state, enabling traders to make educated predictions about potential future price movements.
Key Candlestick Patterns in Day Trading
There are hundreds of candlestick patterns, but some prove more valuable in day trading than others due to their reliability in predicting short-term price movements and trends.
Bullish and Bearish Engulfing Patterns
Engulfing patterns consist of a small candle followed by a much larger one. In a bullish engulfing pattern, a small red candle is followed by a larger green one, suggesting buyers have overtaken sellers and a bullish trend may soon follow. In contrast, a bearish engulfing pattern sees a small green candle succeeded by a bigger red one, indicating a potential downward trend.
Hammer and Shooting Star
These two distinct patterns signal trend reversals. A “hammer” represents a bearish market followed by a bullish one, while a “shooting star” is a bullish market followed by a bearish one. These formations provide the opportunity for traders to spot impending trend shifts early and adjust their positions accordingly.
Doji
Recognized by its thin body, the Doji serves as an indication of market indecision – the open and close prices of the period are virtually the same. Depending on its position in a sequence of candles, a Doji can be a signal of an impending trend reversal.
How to Use Candlestick Patterns in Day Trading
Candlestick patterns can significantly enhance your trading strategy once you understand how to interpret them. They can provide key insights into potential reversals, enabling you to time your entries and exits wisely. Importantly, pairing candlestick patterns with other forms of technical analysis, such as support and resistance levels, enhances their predictive power.
However, no singular pattern guarantees success. Consider these patterns as another line of evidence, providing clues, but not certainties, about future market trends.
In conclusion, candlestick patterns hold enormous potential for active day traders looking for an edge in the competitive trading landscape. They serve as an essential technical analysis tool, providing visual and quick-to-digest insight into market dynamics. Harnessing their power requires practice and patience, but the potential benefits for your day trading profits are undeniably attractive.

